U.S. EST movie transactions grow 68% year-over-year in Q1 2014
Tuesday, June 3rd, 2014
NPD Reports Movies Drive EST Growth with Strong Revenue Increases Continuing Into 2014
PORT WASHINGTON, N.Y. — The electronic sell-through (EST) TV and movie market has grown since 2012 to more than $1 billion with EST sales now representing almost 14 percent of the 2013 physical and digital home video purchases, according to The NPD Group’s EST: Analysis and Perspective.
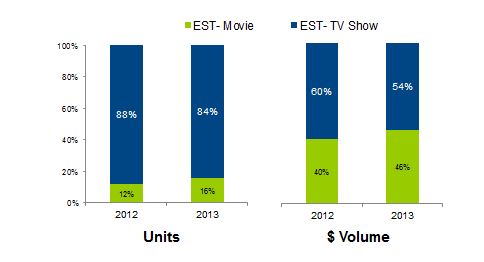
EST movie transactions grew 68 percent year-over-year in Q1 driving most of the total EST sales and accounting for 10 percent of all physical and digital movie purchases. Despite the improved growth of EST movies, EST TV show unit volume is still a much more significant part of the total EST market.
Percentage of EST Movies and TV Show

Source: The NPD Group / VideoWatch/VideoWatch Digital
“Much of the growth in EST is being driven by new digital buyers being drawn into the market,” said Mark Kirstein, president of entertainment for The NPD Group. “Most of the 11 million EST consumers are purchasing digital transactions in addition to physical DVDs and Blu-ray discs; only a small percentage exclusively purchase digital.”
The EST market is getting a boost as new multichannel video programming distributors (MVPD) and digital retailers join the market and new titles get early release windows.
“Comcast joined Verizon as the second major MVPD to offer EST and we expect more to join the EST market moving forward,” said Kirstein. “EST will become an important complement to Video-on-Demand, TV Everywhere, and traditional pay TV services, as it drives incremental revenue and contributes to subscriber retention.”
Methodology
This report is based on consumer research data from the following two sources:
VideoWatch/VideoWatch Digital – A weekly consumer tracking study that provides title and retailer-level movie and TV transactions covering both physical and digital video purchases, physical and digital rentals, subscription rentals, and free streaming TV.
The Entertainment Omnibus Study – A semi-annual (March and September) consumer tracking study that monitors entertainment consumption habits including video, music, gaming as well as device behavior.
Latest News
- Sinclair launches 'Broadspan' datacasting platform
- U.S. households report consuming 43.5 hours of video per week
- A1 Group brings Netflix to six more group countries
- Brightcove introduces Smart TV SDKs for Roku, Samsung and LG devices
- Amagi and Argoid AI drive TV program scheduling automation
- KERV and Magnite programmatically deliver AI-powered interactive video ads