Conviva releases Q2'19 State of the Streaming TV Industry report
Wednesday, August 7th, 2019New Report Reveals Surprise Leaders in Streaming: Dallas, Atlanta and Phoenix Best Tech Hubs Boston, New York and San Francisco Among U.S. Markets
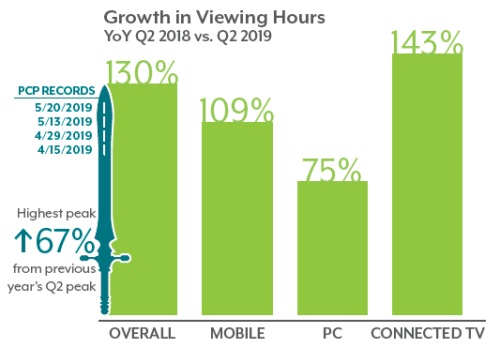
- Overall streaming surges 130% despite ad delivery challenges; Roku again dominates connected TV viewing with 43% share; live outdoes video on demand in quality.
Global streaming media intelligence leader Conviva released the Q2‘19 edition of its State of the Streaming TV Industry report today, revealing that viewing hours grew 130% year over year while streaming quality improved dramatically. The 12-page Conviva report also uncovers eye-opening trends in social media and advertising that impact the entire ecosystem of consumers, publishers and advertisers.
Notable insights from the Conviva report include:
• Unexpected leaders in U.S. streaming consumption. While major markets dominate overall streaming consumption in the United States, Dallas, Atlanta, and Phoenix topped the city list when viewing was normalized by population. Perhaps more surprising, the tech hubs of Boston, New York, and San Francisco lagged significantly.
• The streaming TV advertising crisis expands. Conviva reveals that ad buffering is a direct threat to content engagement with little viewer tolerance for ad quality issues. Streaming ad length averaged 24.87 seconds in Q2 despite a dramatic 70%+ increase in audience abandonment during 20+ second spots as compared to those who abandon during 10 second spots.
• Device wars rage on. The connected TV category led all other devices in growth, up 143% in viewing hours. This was largely driven by Roku with 173% growth and an overall 43% share of connected TV viewing. Amazon Fire TV was up 145% in viewing with an 18% share. Apple TV was up 129% to account for a 10% share.
• Live bests video on demand in quality. The hyper focus on getting it right for live streaming resulted in 13.9% less buffering and 25.6% faster start times than on-demand content, with near-equal average picture quality.
• Video rules social media engagement. Facebook and YouTube saw 15% more videos posted as news media led with the largest growth in average total video views, up 197% year over year. Entertainment led in growth of views per video, up 99%.
“Despite extraordinary growth, streaming is still a nascent market,” says Bill Demas, CEO of Conviva. “As the data shows, audience appetites for content are on the rise with more ways to consume than ever before. Competition for mind share and market share is driving remarkable improvements and innovations industry wide. Publishers, service providers, advertisers, social marketers and brands are all expanding their focus to optimize every moment of the streaming experience. While we are nowhere near the saturation point, it’s imperative that both established players and new entrants recognize that every stream matters and take steps to address all dimensions of their streaming media businesses.”
Conviva’s State of Streaming TV reports are published quarterly and are informed by the streaming industry’s most comprehensive data set. Data is collected from Conviva’s proprietary sensor technology that is currently embedded in 3 billion streaming video applications, tracking in excess of a trillion real-time transactions per day in more than 180 countries.
Latest News
- Nexxen empowers Australian advertisers using VIDAA ACR data
- TargetVideo integrates AI for video content categorization
- Meta opens Quest OS to third-party hardware makers
- Aferian to implement further cost reductions at Amino
- Paramount to exclusively represent SkyShowtime advertising sales
- Sky Sports Main Event latency reduced on Entertainment OS devices