Netflix posts first quarter 2024 results and outlook
Thursday, April 18th, 2024
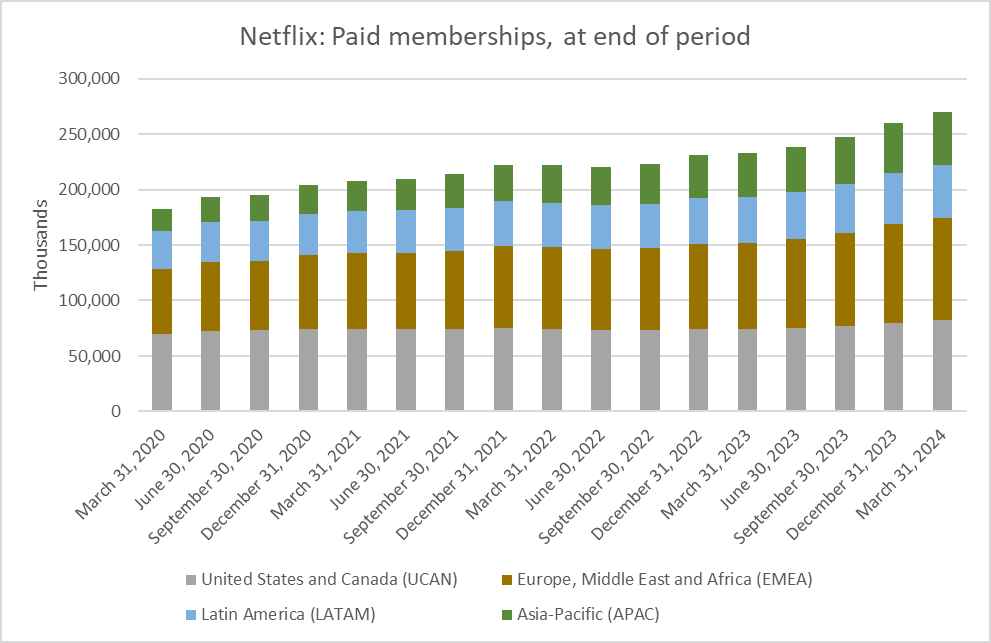
LOS GATOS, Calif. — Netflix, Inc. (NASDAQ: NFLX) has posted its first quarter 2024 financial results and business outlook on its investor relations website. In the quarter the company added 9.33 million paid memberships to finish at 269.60 million globally.
From the Shareholder Letter and Financial Staements:
Summary results, and forecast for Q2
                                                                                      Q2'24
(in millions except per share data)         Q1'23   Q2'23   Q3'23   Q4'23   Q1'24  Forecast
-----------------------------------------  ------  ------  ------  ------  ------  --------
Revenue                                    $8,162  $8,187  $8,542  $8,833  $9,370    $9,491
Y/Y % Growth                                 3.7%    2.7%    7.8%   12.5%   14.8%     15.9%
Operating Income                           $1,714  $1,827  $1,916  $1,496  $2,633    $2,520
Operating Margin                            21.0%   22.3%   22.4%   16.9%   28.1%     26.6%
Net Income                                 $1,305  $1,488  $1,677    $938  $2,332    $2,063
Diluted EPS                                 $2.88   $3.29   $3.73   $2.11   $5.28     $4.68
Global Streaming Paid Memberships          232.50  238.39  247.15  260.28  269.60
Y/Y % Growth                                 4.9%    8.0%   10.8%   12.8%   16.0%
Global Streaming Paid Net Additions          1.75    5.89    8.76   13.12    9.33
Net cash provided by operating activities  $2,179  $1,440  $1,992  $1,663  $2,213
Free Cash Flow                             $2,117  $1,339  $1,888  $1,581  $2,137
Shares (FD)                                 452.4   451.6   450.0   444.3   441.7
Q1 Results
In Q1, revenue grew 15% year over year, or 18% on a foreign exchange (F/X) neutral basis[1], driven primarily by membership growth as well as pricing. ARM[2] rose 1% year over year, or 4% on a F/X neutral basis. The difference between F/X neutral growth and our reported growth was primarily driven by the impact of price increases in Argentina due to local inflation and the 75% decrease in the Argentine peso relative to the US dollar. Revenue was above our guidance as paid net additions (9.3M vs. 1.8M in Q1’23) were higher than we forecast.
Operating income in Q1’24 totaled $2.6B (vs. $1.7B in Q1‘23) — a year over year increase of 54%. This was also above our forecast primarily due to our higher than anticipated revenue and the timing of our content spend. Operating margin of 28% grew seven percentage points year over year (vs. 21% last Q1). EPS for the first quarter was $5.28 vs. $2.88 last year and our $4.49 forecast. Net income included a $131 million non-cash unrealized gain from F/X remeasurement on our Euro denominated debt, which is recognized below operating income in “interest and other income.”
Forecast
As a reminder, the quarterly guidance we provide is our actual internal forecast at the time we report. Our primary financial metrics are revenue for growth and operating margin for profitability. Our goals are to sustain healthy revenue growth, expand our operating margin and grow free cash flow.
For Q2’24, we forecast revenue growth of 16%. This equates to 21% growth on a F/X neutral basis due primarily to price changes in Argentina and the devaluation of the local currency relative to the US dollar. We expect paid net additions to be lower in Q2’24 vs. Q1’24 due to typical seasonality. We forecast global ARM to be up year-over-year on a F/X neutral basis in Q2.
1. Excluding the year over year effect of foreign exchange rate movements and the impact of hedging gains/losses realized as revenues (no hedging gains/losses realized in prior periods). Assumes foreign exchange rates remained constant with foreign exchange rates from each of the corresponding months of the prior-year period.
2. ARM (Average Revenue per Membership) is defined as streaming revenue divided by the average number of streaming paid memberships divided by the number of months in the period. These figures do not include sales taxes or VAT.
Links: Netflix
Latest News
- Amagi report shows rise of a diverse global FAST marketplace
- Broadpeak to power targeted advertising on new TF1 video service
- AA/WARC reports UK 2023 ad spend at £36.6bn
- FCC restores net neutrality
- Five leading TV stations launch NextGen TV in Portland, Maine
- U.S. digital video ad spend growing ~80% faster than media overall