U.S. standalone pay TV ARPU declined 10% from 2016 to 2018
Thursday, August 1st, 2019
Parks Associates: Average Standalone pay-TV Service ARPU Declined 10% from 2016 to 2018
- New study identifies key trends in pay-TV and non-pay-tv video entertainment spending
DALLAS — Research from Parks Associates finds the average standalone pay-TV service ARPU declined 10% from 2016 to 2018, when consumer-reported monthly spending on pay TV declined from $84 to $76. According to ‘360 View: Entertainment Services in the US,’ pricing pressure for consumer services is forcing increasing conflict in carriage negotiations, which in turn fuels the interest among providers in continued vertical and horizontal consolidation.

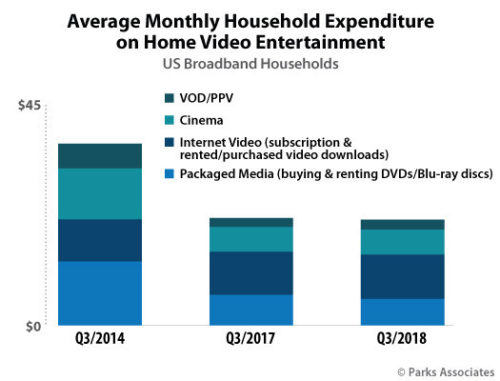
Self-reported expenditures on non-pay-TV home video entertainment also declined 30% per month over the past seven years, peaking at nearly $40 in 2014 to slightly over $20 at the end of 2018, according to the study. Spending on DVD and Blu-ray packaged media has steadily declined since 2012, while spending on movie theaters declined by 50% from 2014 to 2018. Spending on internet video is the only category to hold steady throughout the time frame, staying at $8-9 per month since 2014, showing the power of streaming and downloaded content from the internet.
“Traditional pay-TV providers (MVPDs) have faced continued subscriber losses due to increasing consumer choice from OTT services, so they are deploying skinny bundles and vMVPD services to create more choice among viewers,” said Elizabeth Parks, President, Parks Associates. “For pay-TV service providers, traditional and online, they are exploring new areas in content ownership and development, and to be successful in these efforts, understanding consumer activity and motivation related to adoption and use of their services is critical.”
“Subscription online video is the only growth category for consumer-paid video entertainment beyond pay TV. Operators, struggling with declining ARPU for standalone pay-TV services, are anxious to leverage this trend,” said Brett Sappington, Senior Research Director and Principal Analyst, Parks Associates. “Operators are taking differing approaches. Some, including Comcast and DISH, are offering subscriptions to third-party OTT video services and are integrating them into their discovery interfaces. Partnering gives operators a chance to serve as content aggregator, a familiar position. Others, including AT&T and DISH, are expanding their competitive reach online and have introduced vMVPD services.”
‘360 View: Entertainment Services in the US’ provides a comprehensive view of the US marketplace for pay-TV services, including changes in adoption, services taken, churn, and spending among key consumer segments, including upgraders, downgraders, new subscribing households, cord cutters, cord shavers, and OTT subscribers. It also assesses demand for entertainment service features and compares perception, demand, and use among leading US operators. Other highlights:
- 20% of US broadband households do not have a pay-TV services.
- NPS for traditional pay-TV services is weaker than for other content service types.
- In 2018, the average number of connected devices per broadband household, excluding smart home devices, reached 8.4.
- 12% of US broadband households eliminated pay-TV service (cut the cord) in 2018.
Latest News
- Barb to start reporting TV-set viewing of YouTube channels
- SAT FILM selects multi-DRM from CryptoGuard
- Qvest and ARABSAT to launch OTT streaming platform
- ArabyAds & LG Ad Solutions partner with TVekstra in Turkey
- Freeview NZ satellite TV service to move to Koreasat 6
- Comscore expands YouTube CTV measurement internationally
