
U.S. digital entertainment consumer spending grew $3.7bn in 2022
Tuesday, March 7th, 2023
DEG: The Digital Entertainment Group today released its Year-End 2022 Digital Media Entertainment Report compiled by DEG members, tracking sources and retail/platform input.[1]
- U.S. Consumer Spending on Digital Entertainment Purchases, Rentals and Subscriptions Grew by $3.7 Billion in 2022, Topping $36.5 Billion
- Viewer Spend on Subscription Streaming Surpassed $30 Billion; Ad Revenue from AVOD/FAST Channel Streaming Approaching $17 Billion, According to Omdia
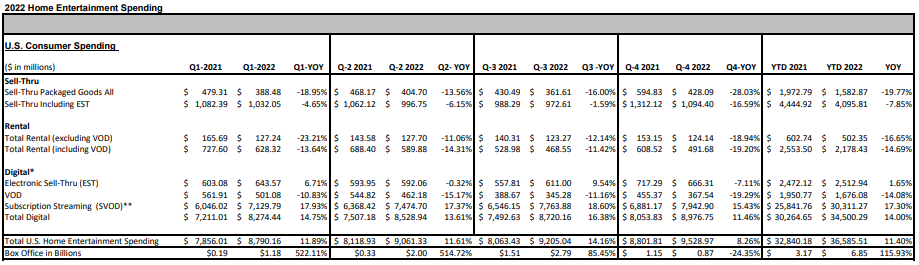
Overall U.S. consumer spending across digital and physical home entertainment formats in 2022 was more than $36.5 billion, an 11.4 percent increase from the almost $33 billion consumers spent in 2021, driven by a raft of strong franchise properties coming from theaters and television.
Consumers spent $34.5 billion on digital entertainment purchases (EST[2]), rentals (VOD[2]) and subscriptions for the full year, a jump of 14 percent over full year 2021. Spending on subscription streaming rose more than more than 17 percent for full year 2022, topping $30 billion.
In the year’s final quarter, overall consumer spending rose 8.3 percent, representing just over $9.5 billion, even though box-office spending on the titles released to the home in the fourth quarter fell almost 25 percent from the year earlier period. New theatrical releases are historically a key driver of home entertainment spending. Consumers spent almost $9 billion on digital entertainment purchases (EST), rentals (VOD) and subscriptions in the fourth quarter of 2022, an increase of 11.5 percent.
Among the highlights for the Fourth Quarter and Full Year 2022:
- Digital purchases (EST) were up 2 percent for the year, with spending on theatrical content up 11 percent and spending on TV content down 13 percent.
- After strong gains in the first three quarters of the year, digital purchases (EST) of theatrical content were down 16 percent in the fourth quarter. This was due to smaller box office titles released, including less favorable home entertainment genres like horror and comedy.
- The surge in theatrical new releases in the first three quarters also benefited premium physical formats, with spending on 4K UHD Blu-ray titles ending the year with 20 percent growth. The most in-demand 4K UHD titles of 2022 reflect many of the year’s biggest titles overall, including The Batman, Doctor Strange in the Multiverse of Madness, Jurassic World: Dominion, SpiderMan: No Way Home and Top Gun: Maverick.
- Digital purchases (EST) of TV product experienced declines of 12.8 percent for the full year, but only 2.2 percent in the fourth quarter, which was driven by strong demand for the most recent season of the megahit series Yellowstone, along with previous seasons and the spinoff 1883.
- Among the year’s best-performing titles across all transactional formats, excluding Premium, were Dune, Encanto, Everything Everywhere All at Once, Ghostbusters: Afterlife, Jurassic World: Dominion, Moonfall, No Time to Die, Sing 2, Spider-Man: No Way Home, Top Gun: Maverick, Uncharted and Yellowstone Season 5.
- Premium digital releases enjoy strong consumer interest and spending in this window is included in DEG tracking for 2022.[2]
- U.S. consumer spending on subscription streaming[3] rose to $7.9 billion in fourth quarter 2022, with growth slowing slightly to 15.4 percent. Spending on subscription streaming for the full year was $30 billion, an increase of more than 17 percent.
- In parallel, ad-supported premium AVOD and FAST content reached an estimated advertising revenue of $16.8 billion in 2022 according to estimates from Omdia[4], as more major streamers diversified their offerings to include lower cost subscription plans with ads. Omdia estimates show ad revenue grew by more than 40 percent for the full year.
2022 Home Entertainment Spending
U.S. Consumer Spending ($in millions)
                                          YTD 2021    YTD 2022      YOY
                                        ----------  ----------  -------
Sell-Thru
 Sell-Thru Packaged Goods All            $1,972.79   $1,582.87  -19.77%
 Sell-Thru Including EST                 $4,444.92   $4,095.81   -7.85%

Rental
 Total Rental (excluding VOD)              $602.74     $502.35  -16.65%
 Total Rental (including VOD)            $2,553.50   $2,178.43  -14.69%

Digital*
 Electronic Sell-Thru (EST)              $2,472.12   $2,512.94    1.65%
 VOD                                     $1,950.77   $1,676.08  -14.08%
 Subscription Streaming (SVOD)**        $25,841.76  $30,311.27   17.30%
Total Digital                           $30,264.65  $34,500.29   14.00%

Total U.S. Home Entertainment Spending  $32,840.18  $36,585.51   11.40%

Box Office in Billions                       $3.17       $6.85  115.93%
* Digital transaction spending (EST and VOD) includes premium releases, but not Disney+ Premier Access titles
** SVOD data sourced from Omdia (technology.informa.com). Disclaimer: The data is not an endorsement and reliance is at a third party’s own risk.
Disclaimer: This report contains information compiled from sources that the DEG believes have accurately reported such information, but which the DEG has not independently checked or verified. As such, the DEG does not warrant its accuracy or reliability. The report is not intended to provide investment or securities advice.
1. Please note, these numbers are preliminary. Contact DEG for an updated version in March.
2. Digital transaction spending (EST and VOD) includes premium releases, but not Disney+ Premier Access titles.
3. SVOD data sourced from Omdia.
4. Ad revenue estimates sourced from Omdia. Includes Discovery+, Disney+, Freevee, HBO Max, Hulu, LG Channels, Netflix, Paramount+, Peacock, Pluto TV, Roku Channel, Samsung TV+, Tubi, Vix, Vizio WatchFree+, as well as legacy TV Everywhere services and other premium AVOD/FAST.
– All figures are net advertising revenues. They denote the revenue generated by a media owner from advertising.
– Excludes social video services such as YouTube or TikTok.
– For hybrid services, such as Hulu, the data represents only the advertising revenue and does not include subscription revenue generated by the hybrid tier.
-Data represents the U.S. only and is preliminary.
Latest News
- Barb to start reporting TV-set viewing of YouTube channels
- SAT FILM selects multi-DRM from CryptoGuard
- Qvest and ARABSAT to launch OTT streaming platform
- ArabyAds & LG Ad Solutions partner with TVekstra in Turkey
- Freeview NZ satellite TV service to move to Koreasat 6
- Comscore expands YouTube CTV measurement internationally