Europe is not cord-cutting right across the board
Thursday, June 13th, 2019
Pay AV services in Europe: the state of play
- With a 40% share in 2017, pay AV services (pay-TV and SVOD) represented the main contributor and driver of the AV services market over the ten-year period studied
- SVOD expansion didn’t really weaken the upswing in pay AV services revenues, and did capture most of it
- Pay-TV has still been thriving in some SVOD stronghold countries: cord-cutting is still very dependent on the different parameters of national markets, not a pan-European phenomenon
- Netflix, Comcast and Liberty Global between them controlled 1/3 of all EU subscriptions to pay AV services in 2017
STRASBOURG, FRANCE — European Audiovisual Observatory publishes a new report on pay audiovisual services (pay TV and SVOD) in Europe.
This brand-new market intelligence report has just been published by the European Audiovisual Observatory, part of the Council of Europe in Strasbourg. It gives the big picture of the pay audiovisual services market in Europe and its development by providing key figures for the two main segments: linear pay-television (pay-TV) and subscription video-on-demand (SVOD). The report also analyses the main factors likely to influence their development and identifies three major market configurations as regards the interactions between linear pay-TV and SVOD. Last but not least it covers their distribution and the key market players.
I. Pay AV services are driving AV market revenues
The report’s author, Observatory Analyst Laura Ene, finds that pay-TV and SVOD get the lion’s share of the AV services market. Pay AV services accounted for 40% of the AV services market in 2017 with pay-TV representing 90% and SVOD the remaining 10%.
Pay AV services are growing faster than the rest of the AV services market (pay AV services revenues clearly drove the AV market between 2008 and 2017 with a 5.2% compound annual growth rate).
Evolution of AV services market by revenue stream in Europe | 2017 – In EUR million
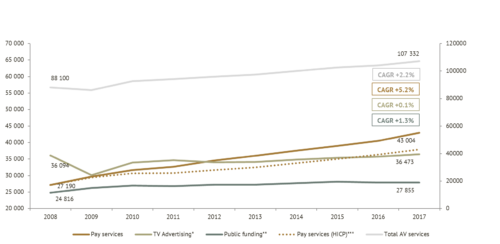
Source: European Audiovisual Observatory analysis of Ampere Analysis data
II. The growth of pay AV services revenues is mostly captured by SVOD
The surge of SVOD did not cause a significant slowdown of the pay AV services market, but did capture most of the revenues growth. The pay AV services subscriptions increase was driven by SVOD, however with a much lower ARPU (average revenue per user) than pay-TV.
Pay AV services revenues evolution in Europe | 2008/2017 – In EUR million
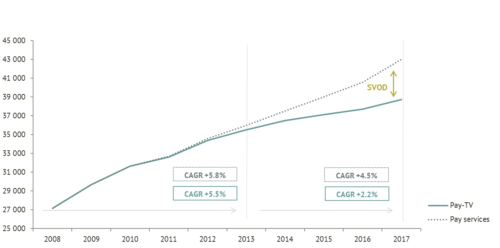
Source: European Audiovisual Observatory analysis of Ampere Analysis data
III. Cord-cutting primarily depends on local market conditions
One of the major findings of this new report is that cord-cutting is not taking place right across the board in Europe and is very specific to national markets. Each national market has been and is still shaped by very specific conditions, often exogenous to the pay audiovisual services, including purchasing power, supply of free services, penetration and performance of broadband access and, obviously regulation.
Due to the specific convergence of market factors, both pay-TV and SVOD uptakes and market shares paint a very different picture from one country to another as well as from one player to another. This is the result of a strong granularity of pay AV services’ market strategies.
The author analysed the impact of some of these factors and has summarized in the chart below 3 central pay-TV strategies in the view of SVOD expansion in Europe.
The key message is that cord-cutting is one of the pay AV services market realities in Europe – but not the only one. It is not ubiquitous since it depends on the national market conditions of a highly diverse European pay AV services landscape.
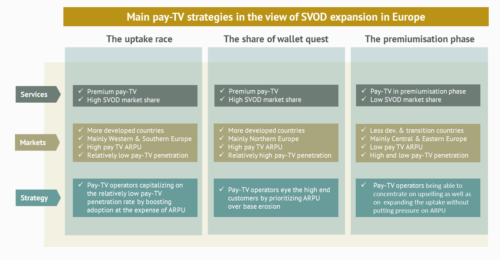
Source: European Audiovisual Observatory
IV. OTT is driving the adoption of pay AV services, while cable remains the first network of choice for pay-TV distribution
80% of the pay AV services’ net additions were delivered by OTT (50%) and IPTV (30%) between 2008 and 2017.
Pay-TV adoption growth was driven by IPTV (61%) and Satellite (39%) over the same ten-year period. However, the pay-TV base was still dominated by cable in 2017 but with a market share almost 20% lower than in 2008 as the erosion of cable subscribers took hold between 2013 and 2017.
Pay AV services distribution by subscriptions in Europe | 2008/2017 – In Thousands and %
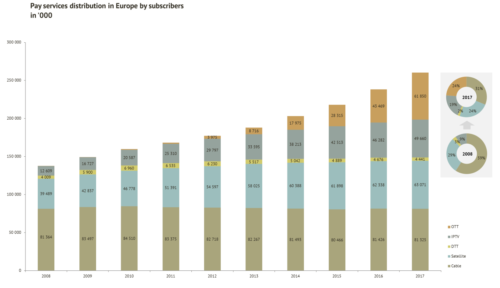
Source: European Audiovisual Observatory analysis of Ampere Analysis data
V. Netflix, Comcast and Liberty Global lead the European pay AV services market in terms of subscriptions
The report finds that Netflix, Comcast and Liberty Global controlled 1/3 of all EU subscriptions to pay AV services in 2017. Almost 1 in 3 pay-TV subscriptions were signed off either to Liberty Global (UPC, Ziggo, Virgin TV, Telenet, Unitymedia TV) or Comcast (Sky), while Netflix and Amazon alone accounted for almost 80% of the SVOD subscriptions in the EU.
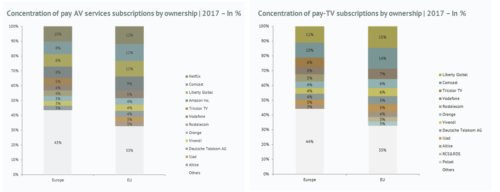
Source: European Audiovisual Observatory analysis of Ampere Analysis data
Latest News
- Amagi report shows rise of a diverse global FAST marketplace
- Broadpeak to power targeted advertising on new TF1 video service
- AA/WARC reports UK 2023 ad spend at £36.6bn
- FCC restores net neutrality
- Five leading TV stations launch NextGen TV in Portland, Maine
- U.S. digital video ad spend growing ~80% faster than media overall