
Americans love streaming TV but can't give up 'destination television'
Thursday, September 28th, 2017Americans Love Streaming TV Services but Can’t Give Up ‘Destination Television,’ J.D. Power Finds
- Over-the-Top Streaming Services Gain in Customer Satisfaction, but Regularly Scheduled Program Viewing Continues to Rise
COSTA MESA, Calif. — Pay-TV subscribers in the United States are growing increasingly satisfied with over-the-top streaming TV services vs. traditional cable TV, but they also are spending nearly an hour more a week watching regularly scheduled television programming than they did two years ago. That increasingly complex consumer relationship with streaming and cable television is explored in detail in a trio of J.D. Power studies released today.
“Although it seems like the world is consumed with the idea of cord-cutting in the wake of Hulu’s first Emmy and the proliferation of new shows on Netflix and Amazon, the number of current pay-TV customers who plan to cut the cord has actually declined, and the number of hours spent watching old-fashioned, time-slot television is growing,” said Peter Cunningham, Technology, Media, and Telecommunications Practice Lead at J.D. Power. “We’re seeing a trend toward the co-existence of traditional and alternative service providers, with each offering some lessons to the other on how best to drive an increase in customer satisfaction.”
Following are some of the key findings of the study:
- Streaming services make gains as traditional TV declines: Customer satisfaction with the overall streaming video service experience (7.91 on a 10-point scale) and performance and reliability (7.97) has slightly improved year over year. Conversely, overall satisfaction with traditional pay-TV services has fallen to 710 this year (on a 1,000-point scale) from 724 last year.
- Destination TV viewing reaches three-year high: Despite growing satisfaction with streaming video services and widespread use of DVR and video on-demand, the number of hours spent watching regularly scheduled television programs has increased by nearly an hour between 2015 and 2017. In a typical week, households have spent an average of 17.4 hours watching regularly schedule programming this year, up from 16.6 in 2015.
- Percentage of likely cord-cutters declines slightly: The percentage of customers who say they plan to cut the cord on pay-TV during the next 12 months has declined to 8% this year from 9% in 2016.
- Mobile app adoption low, but satisfaction high among early adopters: Nearly two-thirds (65%) of pay-TV customers never watch content from their provider via mobile app, and only 6% say they watch via mobile on a daily basis. However, overall satisfaction with pay-TV providers increases as the frequency that customers use a mobile app to watch their provider’s content increases.
- Billing errors present challenge and opportunity: Though the incidence of billing errors has steadily decreased over the past five years, hidden fees continue to be the most common billing error by a large margin. Provider efforts to address this have paid off. Billing satisfaction among customers who experienced a billing error and are given an automatic credit or refund slightly exceeds that among customers who did not experience any billing errors (768 vs. 760, respectively).
Provider Rankings
Residential Internet Service Provider Satisfaction Study
Verizon ranks highest in the East region (737); AT&T/DIRECTV ranks highest in the North Central region (699); Charter Spectrum ranks highest in the South region (717); and Cox Communications ranks highest in the West region (706).
Residential Telephone Service Provider Satisfaction Study
Verizon ranks highest in the East region (757); AT&T/DIRECTV ranks highest in the North Central region (733) and South region (742); and Cox Communications ranks highest in the West region (734).
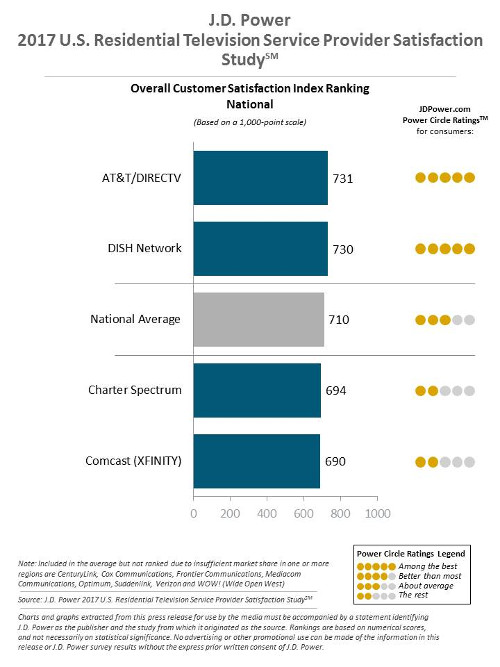
Residential Television Service Provider Satisfaction Study
AT&T/DIRECTV performs highest in overall satisfaction in the national segment with a score of 731. Due to small market share, Verizon was not eligible for the national segment but does rank highest in the East region (755). DISH Network ranks highest in the North Central region (722) and South region (740). AT&T/DIRECTV ranks highest in the West region (726).
The annual wireline studies, now in their 16th year, evaluate residential customers’ experiences with TV, internet and phone services in four geographical regions: East, South, North Central and West. The ISP and telephone studies measure customer satisfaction across five factors: network performance and reliability; cost of service; billing; communication; and customer service. The TV study measures satisfaction in those same five factors plus a sixth: programming.
The 2017 U.S. wireline studies are based on responses from 27,415 customers nationwide who evaluated their cable/satellite TV, high-speed internet and telephone service providers. The studies were fielded in four waves: November 2016, January-February 2017, April-May 2017 and July 2017.
Latest News
- Barb to start reporting TV-set viewing of YouTube channels
- SAT FILM selects multi-DRM from CryptoGuard
- Qvest and ARABSAT to launch OTT streaming platform
- ArabyAds & LG Ad Solutions partner with TVekstra in Turkey
- Freeview NZ satellite TV service to move to Koreasat 6
- Comscore expands YouTube CTV measurement internationally