
Ofcom publishes UK Communications Market report 2016
Thursday, August 4th, 2016
- Some 27% of households now own a smart TV
- Older adults watch more live TV than in 2014 but younger adults watch less
- Almost six in ten adults used a video-on-demand (VoD) service in 2015
- A quarter (26%) watch paid-for VoD services each week – up from 18% of in 2014
LONDON — The UK’s communications regulator, Ofcom, has published its annual Communications Market report for 2016.
Television
- Broadcast TV generated record revenues of £13.6bn last year – partly driven by pay-TV subscription income rising to £6.2bn. 2015 was also a bumper year for spending on network programmes, reaching £6.5bn – a year-on-year increase of 3% in nominal terms.
- On average, each person in the UK watched 3 hours and 36 minutes of broadcast TV per day in 2015, four minutes less than in 2014. But underlying this were marked differences by age groups. Average daily viewing fell by 15 minutes a day among 16-24 year olds, the biggest annual drop for this group since 2010, while it increased by two minutes among over-65s. Live TV viewing fell by five and a half minutes year on year, while recorded and catch-up viewing within a week of broadcast increased by 1.3 minutes.
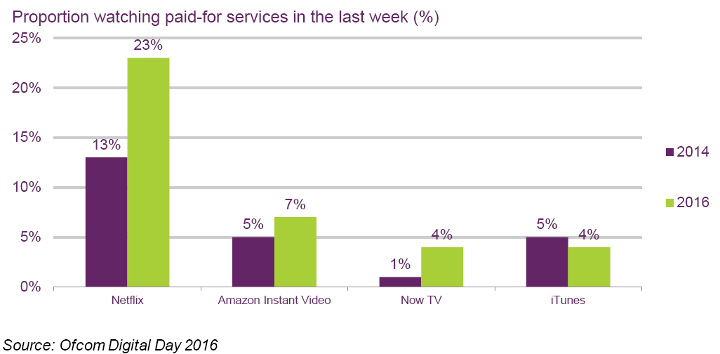
- More than half of UK adults (59%) used a video-on-demand (VoD) service during 2015 – up from 57% in 2014. Although the growth of VoD services is slowing for some age groups, paid-for VoD services continued to grow in popularity, with Netflix a prominent driving force.
- Weekly viewing of paid-for VoD services increased from 18% of UK adults in 2014, to 26% in 2016. Netflix was the most popular service (watched by 23% on a weekly basis – up from 13% in 2014), followed by Amazon Instant Video (7%) and Now TV (4%).
- Breaking Bad was the most watched programme across these three services in 2015.

Since completion of digital switchover (DSO) in October 2012, digital is now the only form of broadcast signal available in the UK.
According to BARB’s Establishment Survey, the proportion of all UK homes that owned a TV set able to receive broadcast television was 95.4% in the final quarter of 2015. The remaining 4.6%, homes without a TV set, either choose to watch audio-visual content using an internet connection only, or do not use a television, or the television does not receive a broadcast signal.
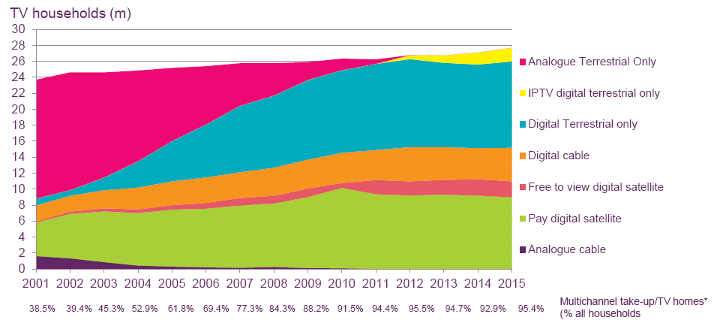
Homes that only have digital terrestrial TV make up the largest proportion of all homes. The proportion with pay-digital satellite has plateaued, particularly since 2011, after peak take-up in 2010. And there has been only incremental growth in digital cable take-up in recent years, while free-to-view satellite services such as Freesat have grown slowly, and account for the smallest proportion of all homes. The Freeview service has been available through a number of providers since 2012. In Q4 2015, 6.1% of homes had any one of BT TV/ TalkTalk/YouView only (without satellite, cable or other platforms), shown below as IPTV digital terrestrial. At the end of 2015, PlusNet launched YouView as part of its offering although take-up data will only be available from Q1 2016.
In addition to the platform take-up highlighted above, many consumers are subscribing to paid-for VoD services on various platforms.
Latest News
- Barb to start reporting TV-set viewing of YouTube channels
- SAT FILM selects multi-DRM from CryptoGuard
- Qvest and ARABSAT to launch OTT streaming platform
- ArabyAds & LG Ad Solutions partner with TVekstra in Turkey
- Freeview NZ satellite TV service to move to Koreasat 6
- Comscore expands YouTube CTV measurement internationally