
Broadcast and cable show signs of revival in U.S.
Thursday, September 15th, 2022Streaming Repeats as Most-Watched TV Format in August, while Broadcast and Cable Show Signs of Revival, according to Nielsen’s Latest Report from The Gauge
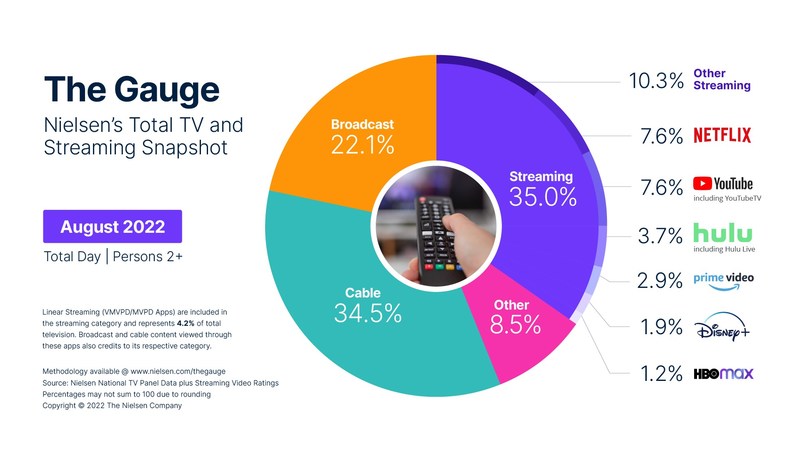
NEW YORK — Nielsen’s (NYSE: NLSN) latest report from The Gauge, the media measurement company’s monthly total TV and streaming snapshot, revealed that streaming usage represented 35% of overall television consumption in August, marking another record-high share for the format and its second month as the the top TV viewing category in The Gauge. Broadcast and cable each gained in August as well, with shares at 22.1% and 34.5%, respectively.
Although total time spent watching TV in August was down slightly compared to July, broadcast, cable and streaming each saw an increase in share compared to the prior month, largely at the expense of the “other” category. Broadcast was the only format to gain in viewing volume in August versus July (+1.6%), while cable and streaming remained fairly flat over the same interval (-0.4% and -0.1%, respectively).
Broadcast’s 1.6% increase in viewing volume translated to an incremental +0.5 share points in August, its first month without a decline since January 2022. This was driven by an 11% viewing bump in the “general variety” genre, which includes shows like Big Brother, and a 3% increase in sports content viewing which was due in part to the MLB Field of Dreams game, several NFL preseason games, and the return of college football. Compared to one year ago, broadcast’s viewing volume was down -10.9% in August and the category lost -2.4 share points.
Cable’s share of TV was up +0.1 share points to 34.5% in August compared to July despite monthly usage remaining fairly flat. The category tracked a 27.4% increase in sports viewing, led by NFL preseason games on ESPN and the NFL Network, in addition to the NASCAR Cup Series on USA Network. Also notable was the 13% increase in cable news viewing—cable’s most-watched genre which makes up 19.3% of cable viewing. Compared to one year ago, cable’s viewing volume was down -9.4% in August and declined -3.0 share points.
While streaming gained +0.2 share points in August, coming in at 35% total share, streaming viewing was flat compared to July. High-profile content on individual streaming platforms drove a number of shifts this month:
- HBO Max recorded a 13.7% increase in viewing volume and a record-high 1.2% share, a lift led by the release of HBO’s House of the Dragon.
- Viewing of Netflix’s Stranger Things steadily declined in August, leading to a 6.5% drop in usage and loss of -0.5 share points, bringing the streaming platform to 7.6% share of TV—only exceeded by Netflix’s shares recorded in June and July 2022.
- Time spent watching YouTube increased 2.8% in August and gained +0.3 share points, tying Netflix’s share for the first time at 7.6% of total TV. YouTube TV viewing, which is included in YouTube’s share of television, increased 14.9% in August compared to July and represented 11.9% of YouTube usage.
Compared to one year ago, streaming consumption was up +22.6% in August, representing a gain of 6.8 share points.
Linear Streaming, including live TV apps offered by MVPDs (multichannel video programming distributors such as Charter/Spectrum and DirecTV apps) and vMVPDs (virtual multichannel video programming distributors such as YouTube TV, Hulu Live), is included in the streaming category and represents 4.2% of total television usage. Broadcast and cable content viewed through linear streaming apps also credits its respective category.
About The Gauge
The Gauge is Nielsen’s monthly snapshot of total TV and streaming usage in the U.S. It is underpinned by Nielsen’s TV ratings service and Streaming Platform Ratings. The latter provides clients with audience measurement data that details the amount of time consumers spend streaming and on which platforms. This broad look at platform usage provides complimentary insights to Nielsen Streaming Content Ratings, which details viewing to subscription-based video on demand (SVOD) content at the title, program and episode level. By showcasing both the micro and macro-level data sets, the industry has a full picture of how this media is being consumed, as well as when and by whom.
Nielsen’s approach to audience measurement, which leverages a geographically representative panel of real people and big data, is built for the future of media consumption. With The Gauge, the future of TV consumption is visible in a single view.
Latest News
- Barb to start reporting TV-set viewing of YouTube channels
- SAT FILM selects multi-DRM from CryptoGuard
- Qvest and ARABSAT to launch OTT streaming platform
- ArabyAds & LG Ad Solutions partner with TVekstra in Turkey
- Freeview NZ satellite TV service to move to Koreasat 6
- Comscore expands YouTube CTV measurement internationally