
UK: TV streaming services overtake pay TV for first time
Wednesday, July 18th, 2018TV streaming services overtake pay TV for first time
- There are now more UK subscriptions to Netflix, Amazon and NOW TV than to ‘traditional’ pay TV services
- Pay TV revenues decline for first time, after a period of sustained growth
- Broadcast TV remains popular, but viewing among 16 to 34-year-olds is moving online
- In music, streaming revenues now outstrip physical sales
The number of UK subscriptions to television streaming services like Netflix has overtaken those to traditional pay television for the first time, marking a major shift in the UK’s viewing habits.
The amount of revenue generated from pay TV has also fallen for the first time, after a period of sustained growth, new research from Ofcom finds.[1]
Spending by the BBC, ITV, Channel 4 and Channel 5, on new UK-made television programmes fell to a 20-year low.[2] At the same time, people are spending less time watching television: average daily broadcast viewing on the television set fell by nine minutes in 2017 – and is down 38 minutes since 2012.
The findings are part of Ofcom’s Media Nations report, a comprehensive study of major trends in the UK’s television, radio and audio sectors, published today.[3]
The report highlights a competitive shift within the UK television industry, driven by the rise of the major global internet companies and the changing habits and preferences of UK audiences. With more choice for viewers than ever before, UK broadcasters are competing for viewers in an increasingly fragmented landscape.
Key findings include:
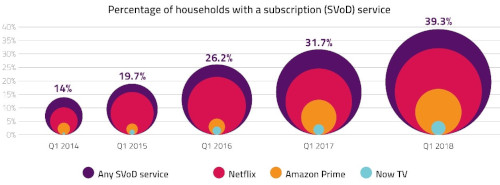
- Streaming overtakes established pay TV. The total number of UK subscriptions to the three most popular online streaming services – Netflix, Amazon Prime and Sky’s Now TV – reached 15.4 million[4] in Q1 2018, overtaking, for the first time, the number of pay TV subscriptions, at 15.1 million; and
- Pay TV revenue declines for first time Following a period of sustained growth, the UK’s pay TV providers saw a 2.7% decrease in total revenue last year to £6.4bn.[5] In contrast, the increasing number of streaming subscriptions[6] contributed to a 28% growth in online audio-visual revenues, to £2.3bn in 2017. Meanwhile, television advertising income fell by 7%, to £3.9bn;
- PSB spending down. The BBC, ITV Channel 4 and Channel 5’s £2.5bn combined network spending on original UK-made programmes in 2017 represents a record low – and is £1bn (28%) less than the 2004 peak of £3.4bn. An increase in funding from third parties towards the cost of programme-making (from £147m in 2008 to £338m in 2017 across the BBC, Channel 4 and Channel 5) has partly helped to mitigate this decline.[7]
- Broadcast TV viewing declines… The amount of time spent watching broadcast television on the TV set has continued to decline and, in 2017, stood at an average of 3 hours 22 minutes a day, down nine minutes (4.2%) on 2016, and 38 minutes (15.7%) since 2012. Among children and viewers aged 16 to 34, declines were steeper, leading to the over-65s watching four times as much broadcast television as children in 2017.[8]
- … As viewing habits shift online. Total daily viewing time across all devices stands at 5 hours one minute, of which two-thirds (three hours 33 minutes or 71%) was to broadcast content, and 1 hour 28 minutes to non-broadcast content. However, among 16 to 34-year-olds, total daily viewing time in 2017 was 4 hours 48 minutes, of which less than half (two hours 11 minutes or 46%) was to broadcast content, while just under an hour per day was spent watching content on YouTube.
Sharon White, Ofcom’s Chief Executive, said: “Today’s research finds that what we watch and how we watch it are changing rapidly, which has profound implications for UK television.
“We have seen a decline in revenues for pay TV, a fall in spending on new programmes by our public service broadcasters, and the growth of global video streaming giants. These challenges cannot be underestimated.
“But UK broadcasters have a history of adapting to change. By making the best British programmes and working together to reach people who are turning away from TV, our broadcasters can compete in the digital age.”
Television and online video revenues in 2017

Average minutes of daily broadcast TV viewing on the TV set, by age

How people are watching TV
The Media Nations report also shows how increased take-up of superfast broadband and connected televisions is driving changes in how people watch TV.
Across all devices, the UK’s total television and audio-visual daily viewing in 2017 reached five hours and one minute.
The majority of this daily viewing (three hours 33 minutes or 71%) was to broadcast television, with the remainder (one hour 28 minutes or 29%) to non-broadcast content, such as YouTube and subscription on-demand services, such as Netflix and Amazon Prime Video.
Younger viewers (age 16-34), however, watched more non-broadcast than broadcast content – an average of 2 hours 37 minutes a day (54%) across all devices, compared with 2 hours 11 minutes (46%) respectively.
Total audiovisual viewing time spent, all individuals vs. 16-34s[9]

Risks to public service broadcasting, but satisfaction remains high
Viewers’ confidence in public service broadcasting remains high. Of those people who watch channels from the public service broadcasters, three-quarters (75%) say they are satisfied, and 84% of people considered trusted news to be the most important feature of their output.
But the report also underlines the challenges facing the UK’s public service broadcasters from changing technology, audience fragmentation and global competition.
It reinforces Ofcom’s call, earlier this year, for UK broadcasters to collaborate to compete to match online competitors’ growing scale. That means UK broadcasters joining forces with each other, or with third parties, to share ideas and pool resources.
Ofcom expects public service broadcasters to adapt for the digital age by finding new ways to distribute programmes; capture younger audiences; and make world-class content that reflects life in the UK – which has not typically been a focus for global internet video streaming companies.
Music streaming overtakes physical sales
As with video streaming, music streaming services, like Apple Music and Spotify, continue to soar in popularity. For the first time, music industry revenues from online streaming subscriptions exceeded physical sales in 2017. Total retail music sales grew by 6% in real terms between 2016 and 2017 driven by a 38% increase in online streaming service subscriptions to £577m.
In contrast, overall sales of physical music formats fell to £470m.The shift away from music ownership towards streaming was reflected by a 25% drop in sales of music downloads.
Almost a quarter (23%) of all adults listen to music via streaming services each week, increasing to over half (51%) of those aged 15-24.
Radio listening reached a significant milestone in the first quarter of 2018, as, for the first time, more than half of all listening hours (50.9%) were through a digital platform – DAB, online or through digital TV.
This is being driven by an increase in the proportion of adults who now have a DAB set (64%) and the greater choice of national commercial stations now available to listeners.
- Despite this decline, pay TV revenue remains significantly higher than revenue generated via subscription video-on-demand subscriptions (£6.4bn versus £895m).
- The 20-year low is for spend on network first-run originations by BBC1, BBC2, ITV, C4, C5 and the BBC portfolio channels combined, in real terms. This figure does not include S4C, BBC Alba and nations and regions original programming spend.
- Media Nations 2018 provides the latest data and analysis on traditional broadcast television and radio services, as well as considering the take-up and impact of subscription on-demand and streaming services. It replaces Ofcom’s previously published PSB Annual Report and Digital Radio Report. It also includes separate reports for Scotland, Northern Ireland and Wales, which replace the individual nations reports previously published as part of our annual Communications Market Report.
- This figure includes subscriptions to multiple subscription video-on-demand services within one household: 11.1 million households (39.4%) have at least one of either Netflix, Amazon or Now TV.
- Subscription revenue’ includes Ofcom’s estimates of Sky UK (including revenue attributed to NOW TV), Virgin TV, BT TV and TalkTalk TV subscriber revenue as well as, in previous years, that of ESPN and Top Up TV in the UK (Republic of Ireland revenue is excluded) on a real terms basis. It also excludes revenue generated by broadband and telephony.
-
- A large proportion of the decline in spend on first-run originated spend by the PSBs has been mitigated by an increase in third party funding, such as co-production arrangements, deficit funding from production companies and tax credits. The combined third-party funding for first run UK originated content across the BBC, Channel 4 and Channel 5 has more than doubled over the last ten years, from £147m in 2008 to £338m in 2017 (with a 19% increase between 2016 and 2017).
- Broadcast viewing among children age 4-15 fell by 15% in 2017 to an average of 1 hour and 26 minutes, and by 12% to an average of 1 hour and 40 minutes among 16-24 year-olds. Over-54s make up 28% of the population of the UK, but accounted for 51% of broadcast television viewing on the TV set in 2017.
- Source: Ofcom/BARB/BARB TV Player (census data)/Touchpoints/ComScore
-

Latest News
- Barb to start reporting TV-set viewing of YouTube channels
- SAT FILM selects multi-DRM from CryptoGuard
- Qvest and ARABSAT to launch OTT streaming platform
- ArabyAds & LG Ad Solutions partner with TVekstra in Turkey
- Freeview NZ satellite TV service to move to Koreasat 6
- Comscore expands YouTube CTV measurement internationally